tl;dr Taraxa has the highest TPS per $ spent in the world
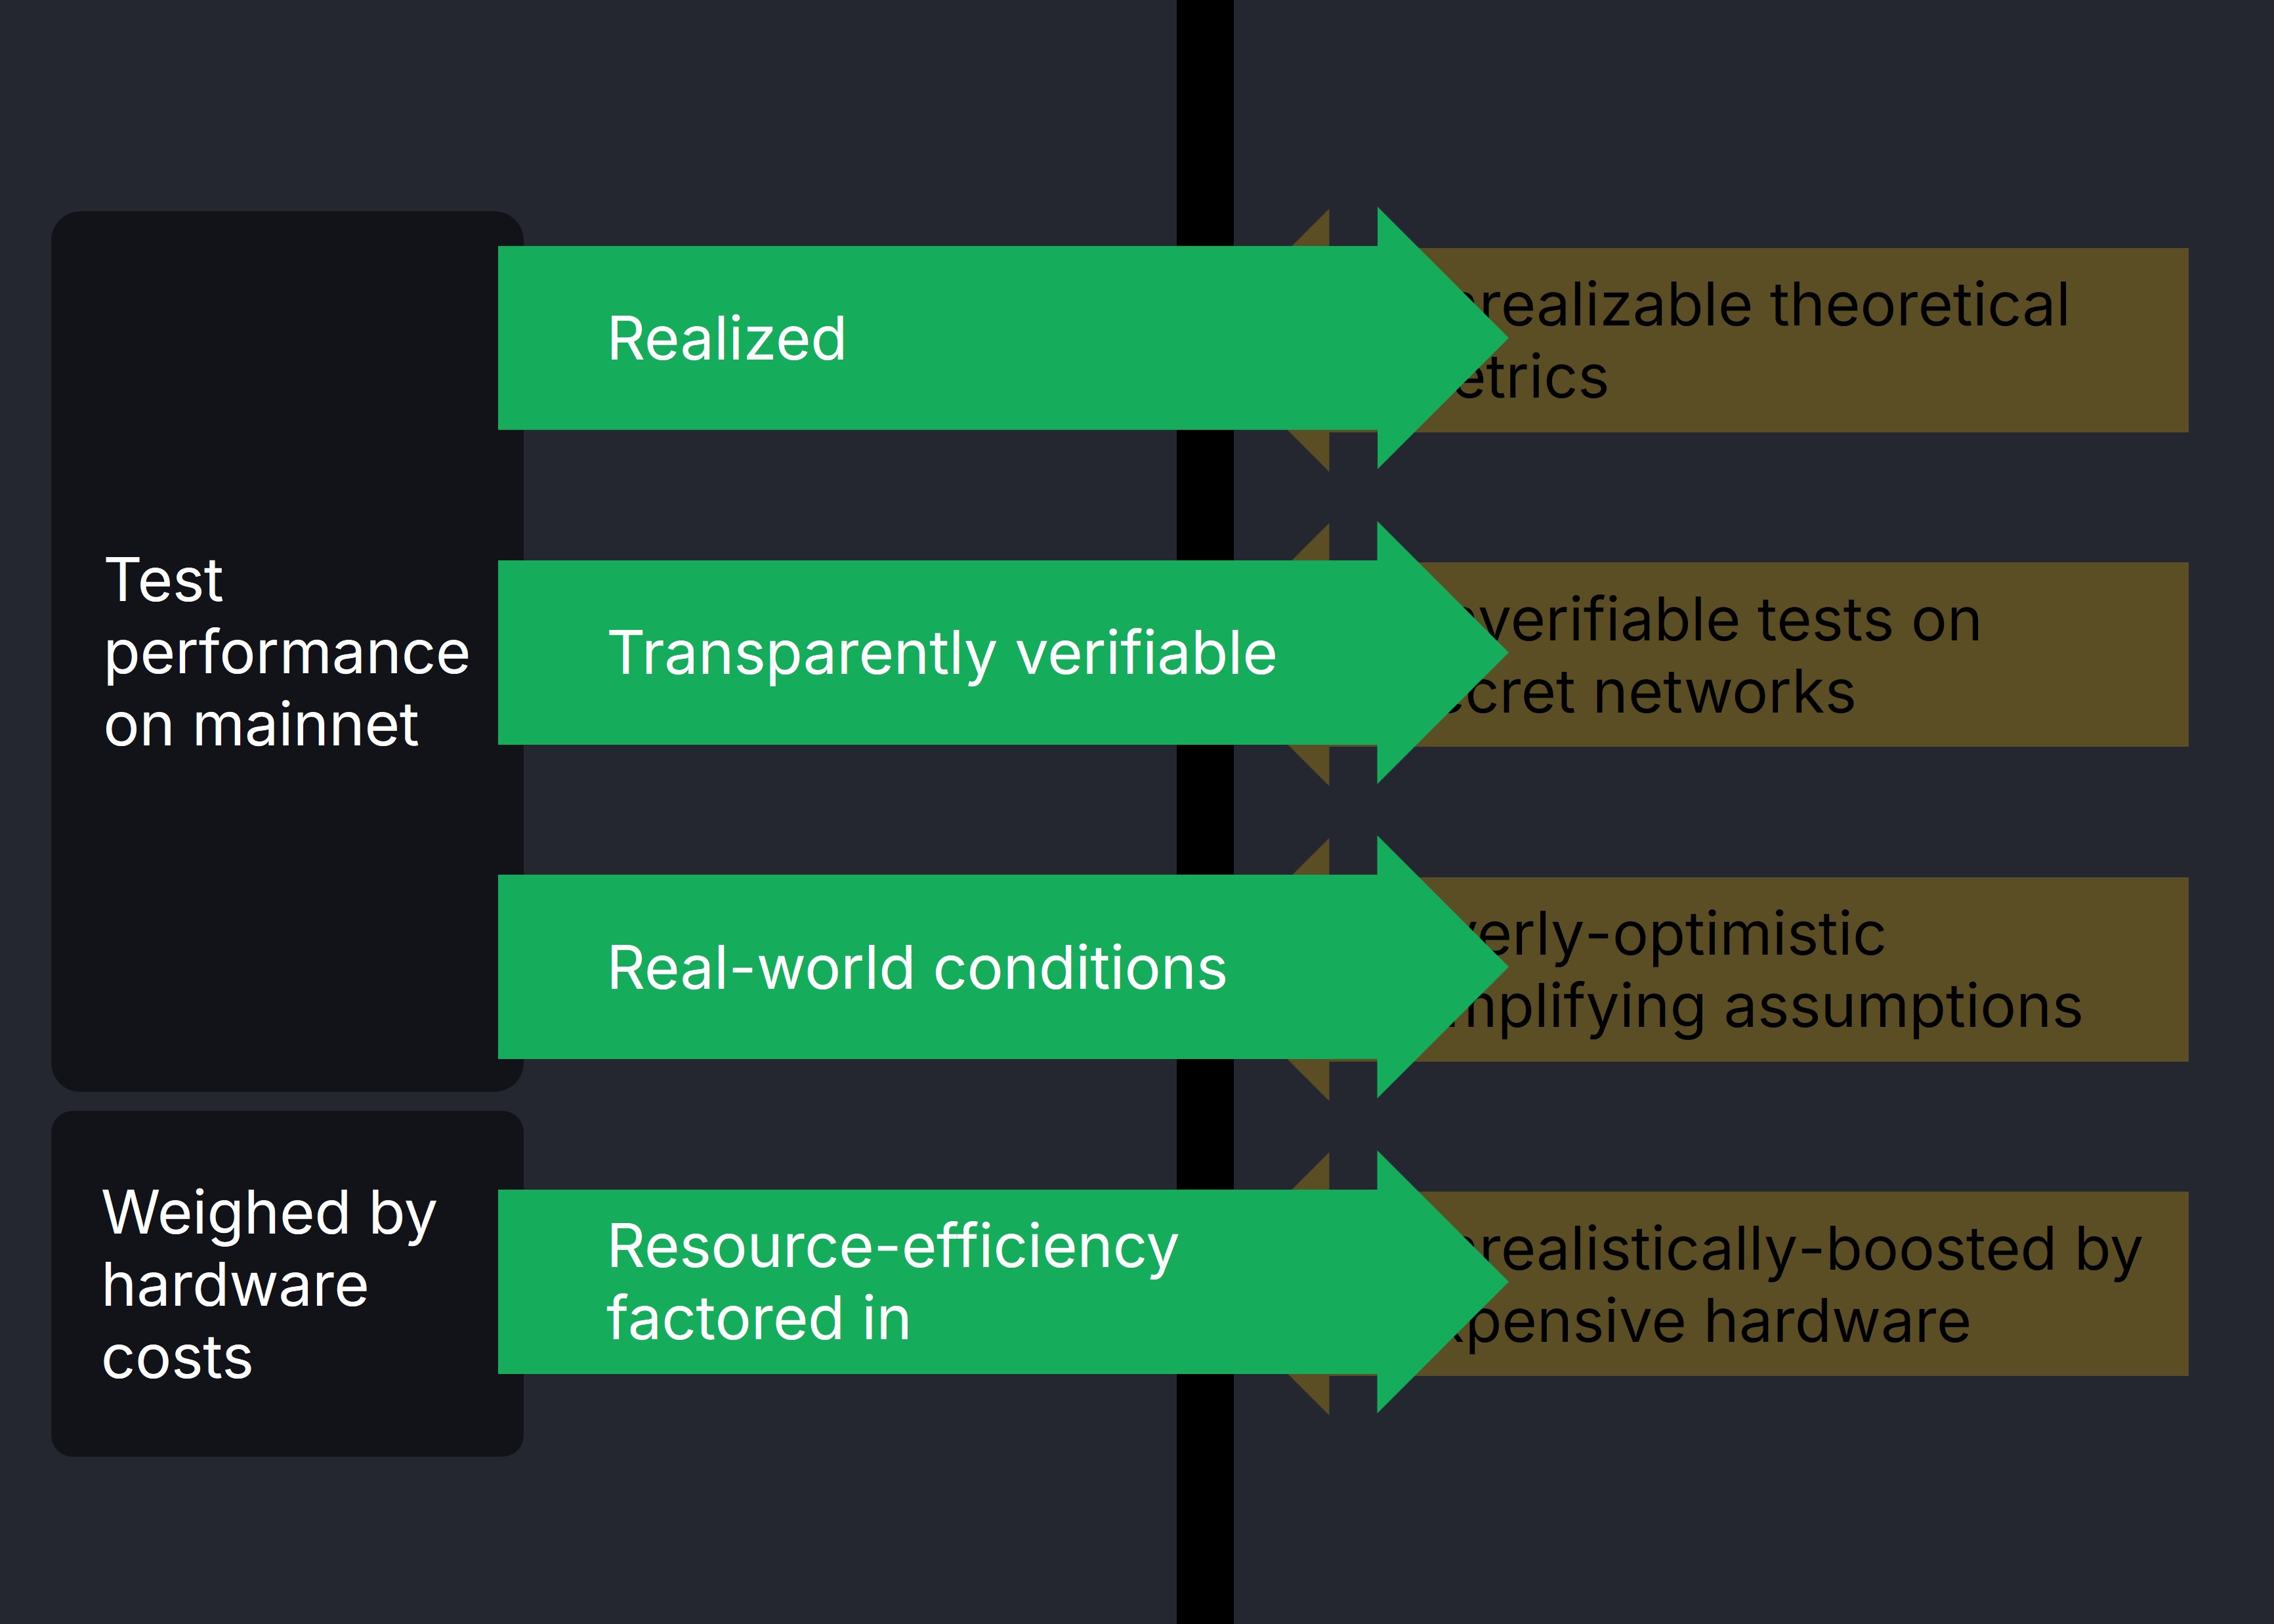
As the Layer-1 field becomes increasingly crowded, the need for better performance metrics goes unfulfilled, thwarted by misleading results published by projects filled with unrealizable theoretical metrics, unverifiable tests on secret networks, overly-optimistic assumptions, and results unrealistically boosted by expensive hardware.
In this study, the Taraxa team breaks through the misleading hype by proposing a metric that is transparently verifiable on networks' mainnets, balanced by hardware efficiency. This study shows that the Taraxa network is the world's #1 Layer-1 which gives you the most throughput per dollar spent on a single validator node.
Last updated: February 24, 2025
All data & cited sources are found in: https://taraxa.io/fast/data
Layer-1s Lack Transparent Performance Metrics
As the number of Layer-1 networks keep increasing, the need to differentiate them also grows. Unfortunately, the market is being flooded with performance metrics that are purely theoretical, measured on secret networks, and artificially-boosted by unrealistic assumptions & supercomputing-level hardware.
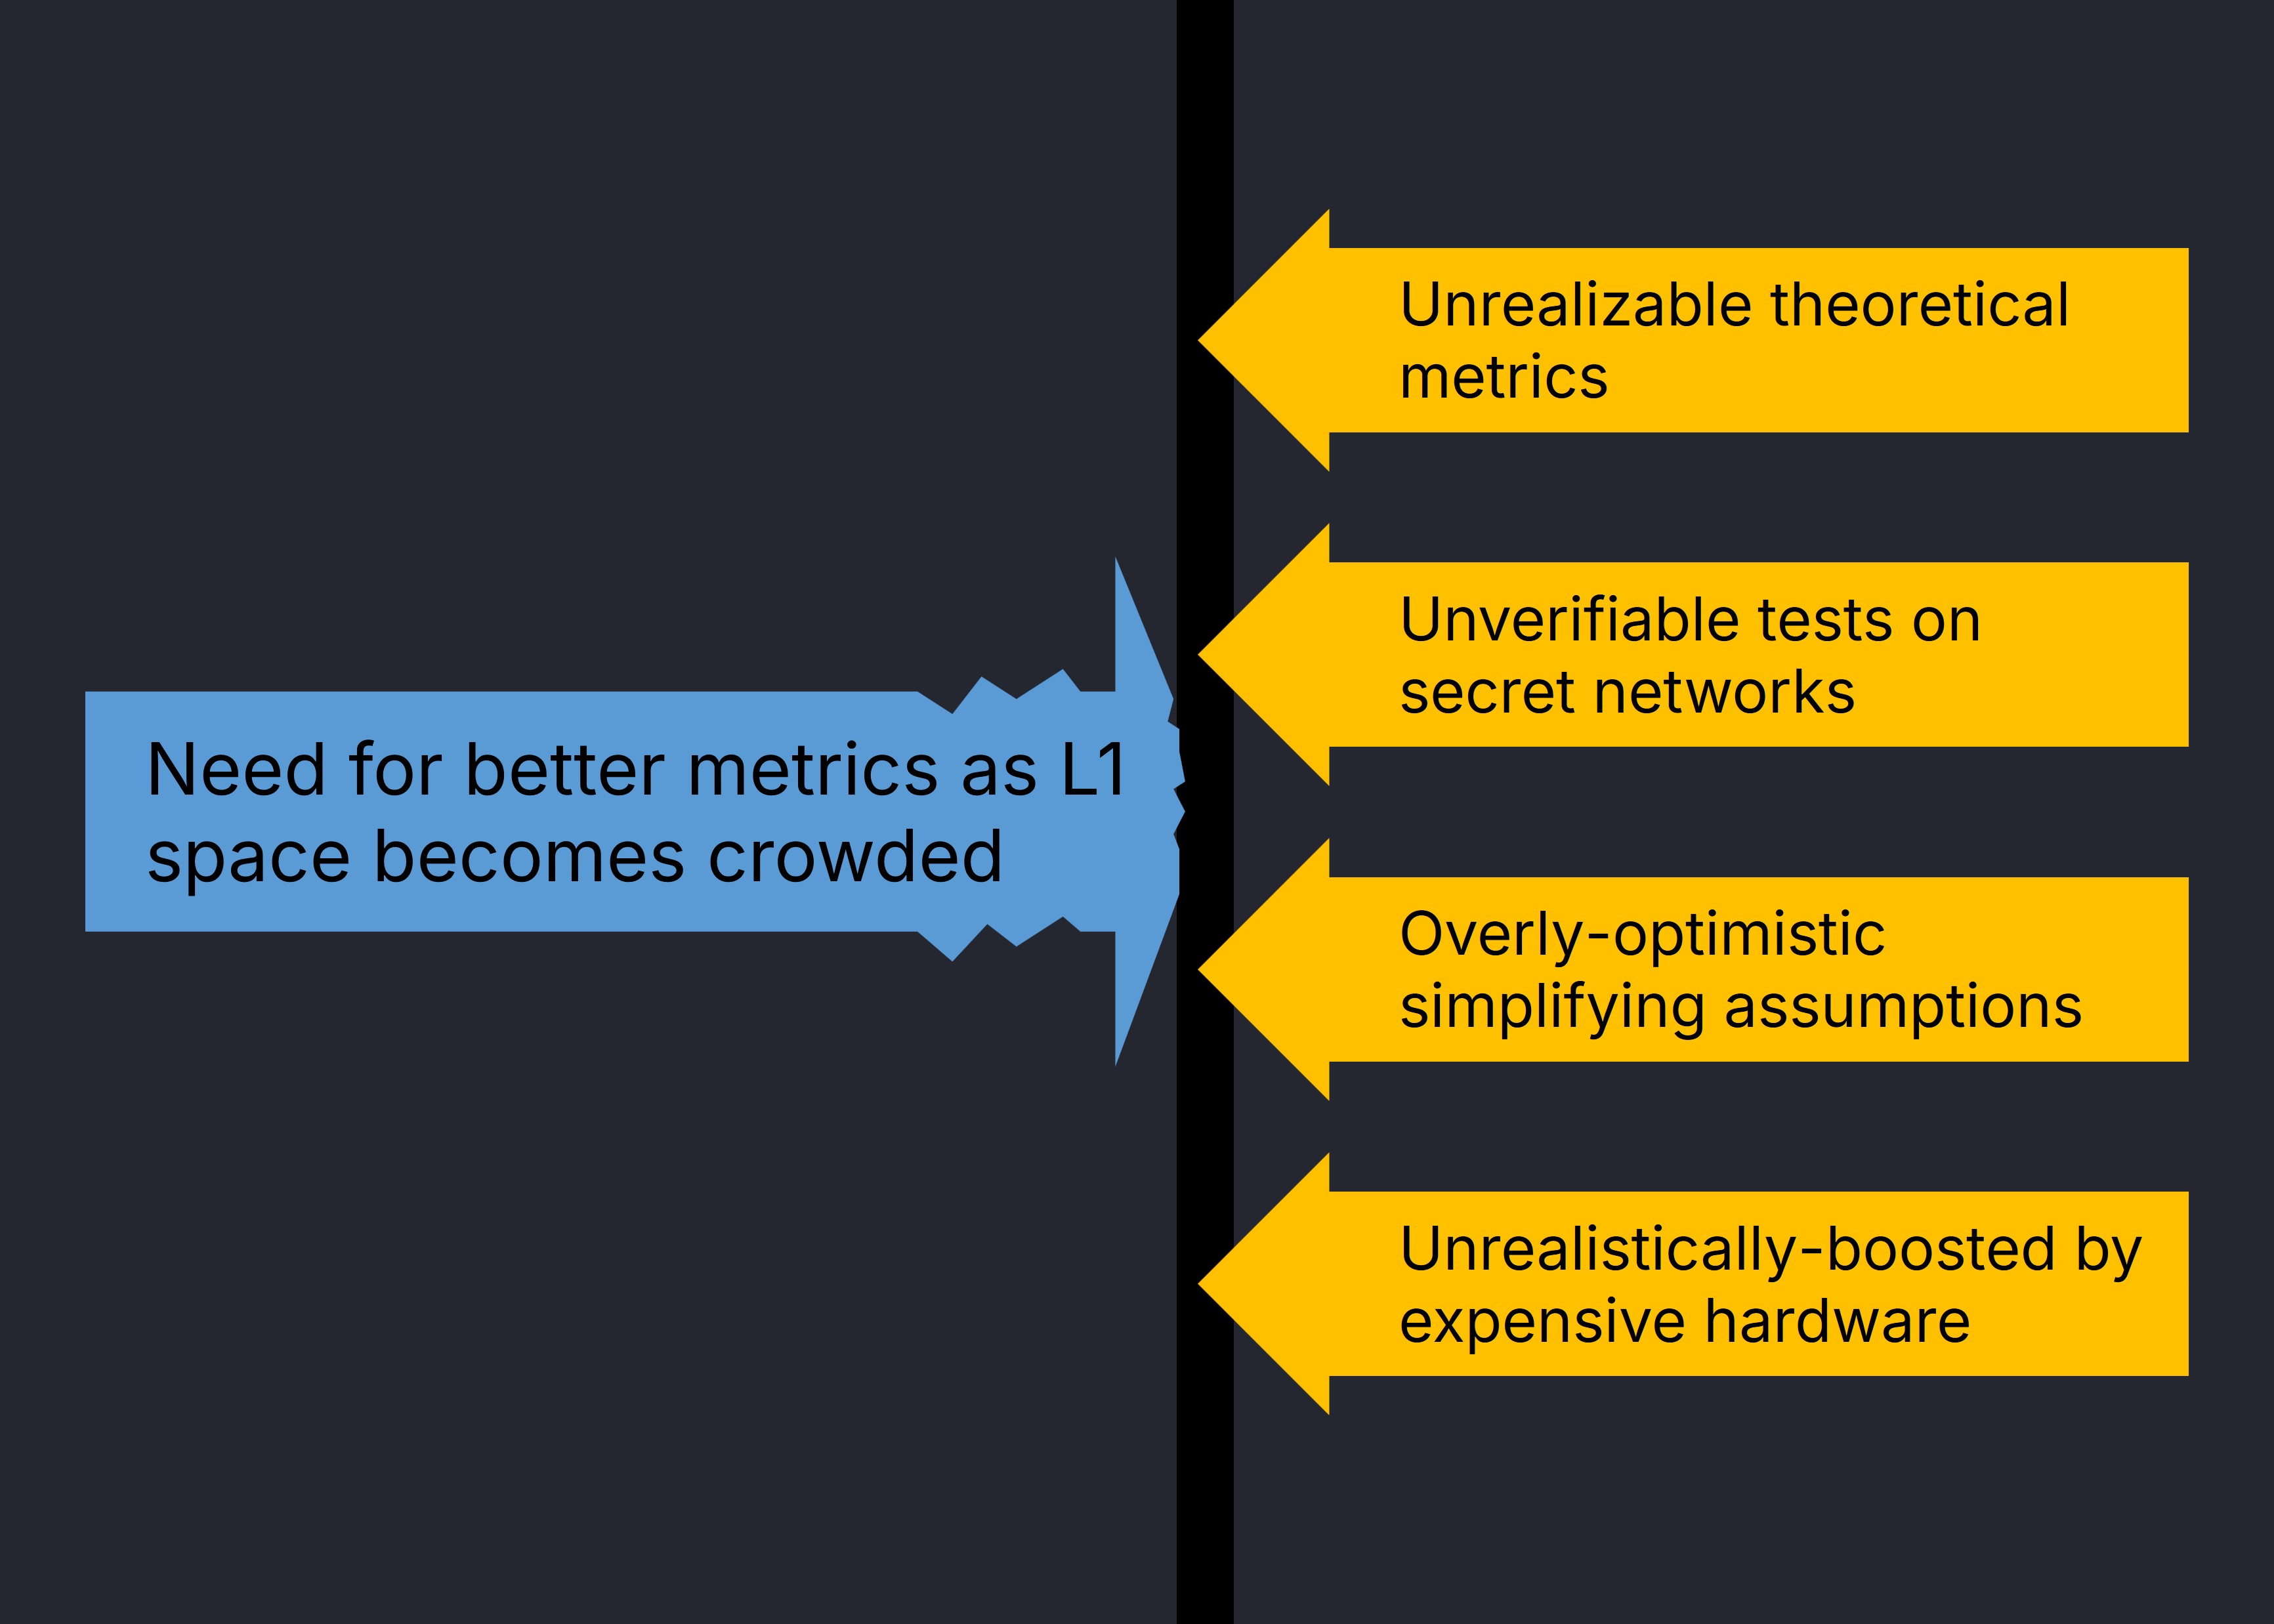
Grossly misleading performance metrics have made it impossible to tell Layer-1 networks apart. We need to break through the hype and noise with transparently verifiable and easily understandable metrics. We need performance metrics that are,
- Transparently visible on public mainnet, so that they're publicly verifiable and realized under real-world conditions
- Weighed by hardware resource consumption, so that efficiency is taken into account
Layer-1s' performance is commonly measured by throughput (TPS) and finality latency. In this report, we'll specifically focus on throughput.
TPS per Dollar: Transparent, Verifiable, Balanced
We propose a transparent throughput metric balanced by resource consumption, "throughput on mainnet per dollar spent on a single validator node", or simply "TPS per Dollar".
This throughput performance metric is transparently verifiable, actually realized (not theoretical) on mainnet under real world conditions, and balanced by hardware efficiency.
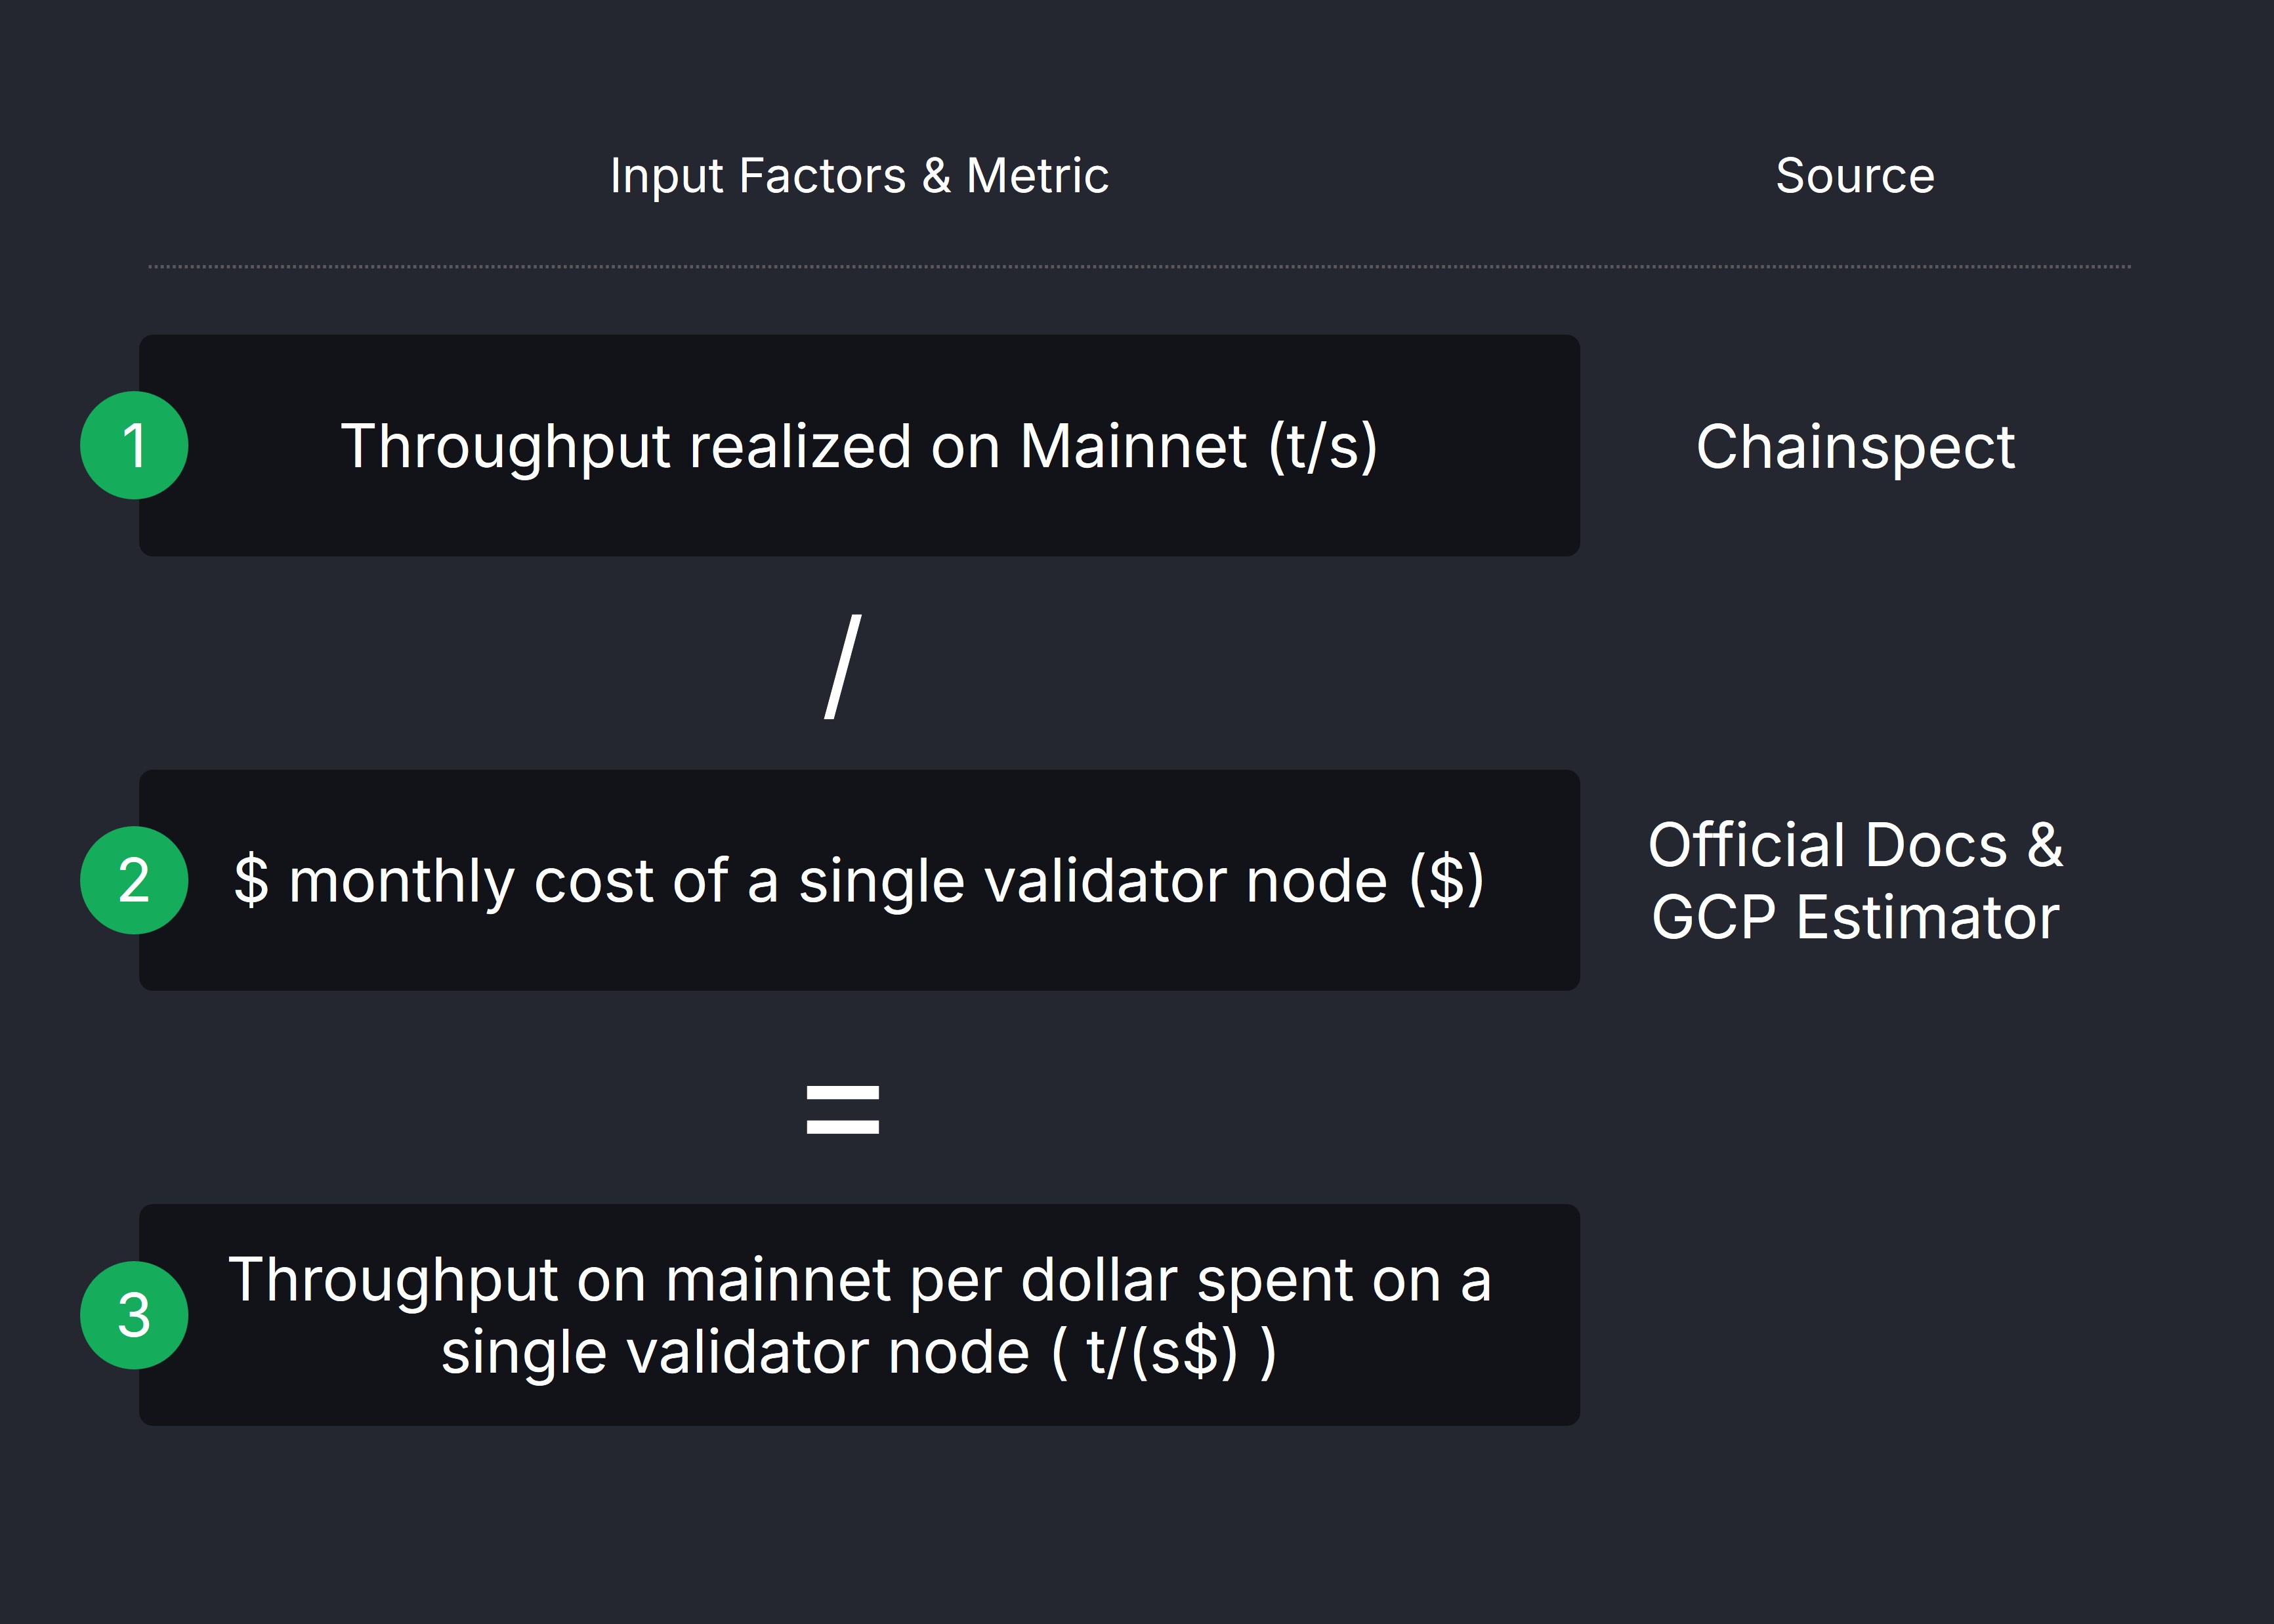
The TPS per Dollar metric is a simple ratio between,
- Actual throughput (TPS) realized on mainnet (tx/s), measured across a 100-block range by Chainspect (under the "Max TPS" column), an independent blockchain performance tracker.
- Estimated monthly dollar cost for a single validator node ($/month), with minimum validator hardware specifications obtained from each Layer-1 network's official documentation, and costs estimated with the Google Cloud Calculator (GCP calculator).
Let's go through the analytics step by step.
Max TPS on Mainnet
To find the maximum historical TPS realized on mainnet, we look to Chainspect's dashboard. As of this writing, there are 34 networks up to and including Ethereum when sorted by Max TPS in descending order.
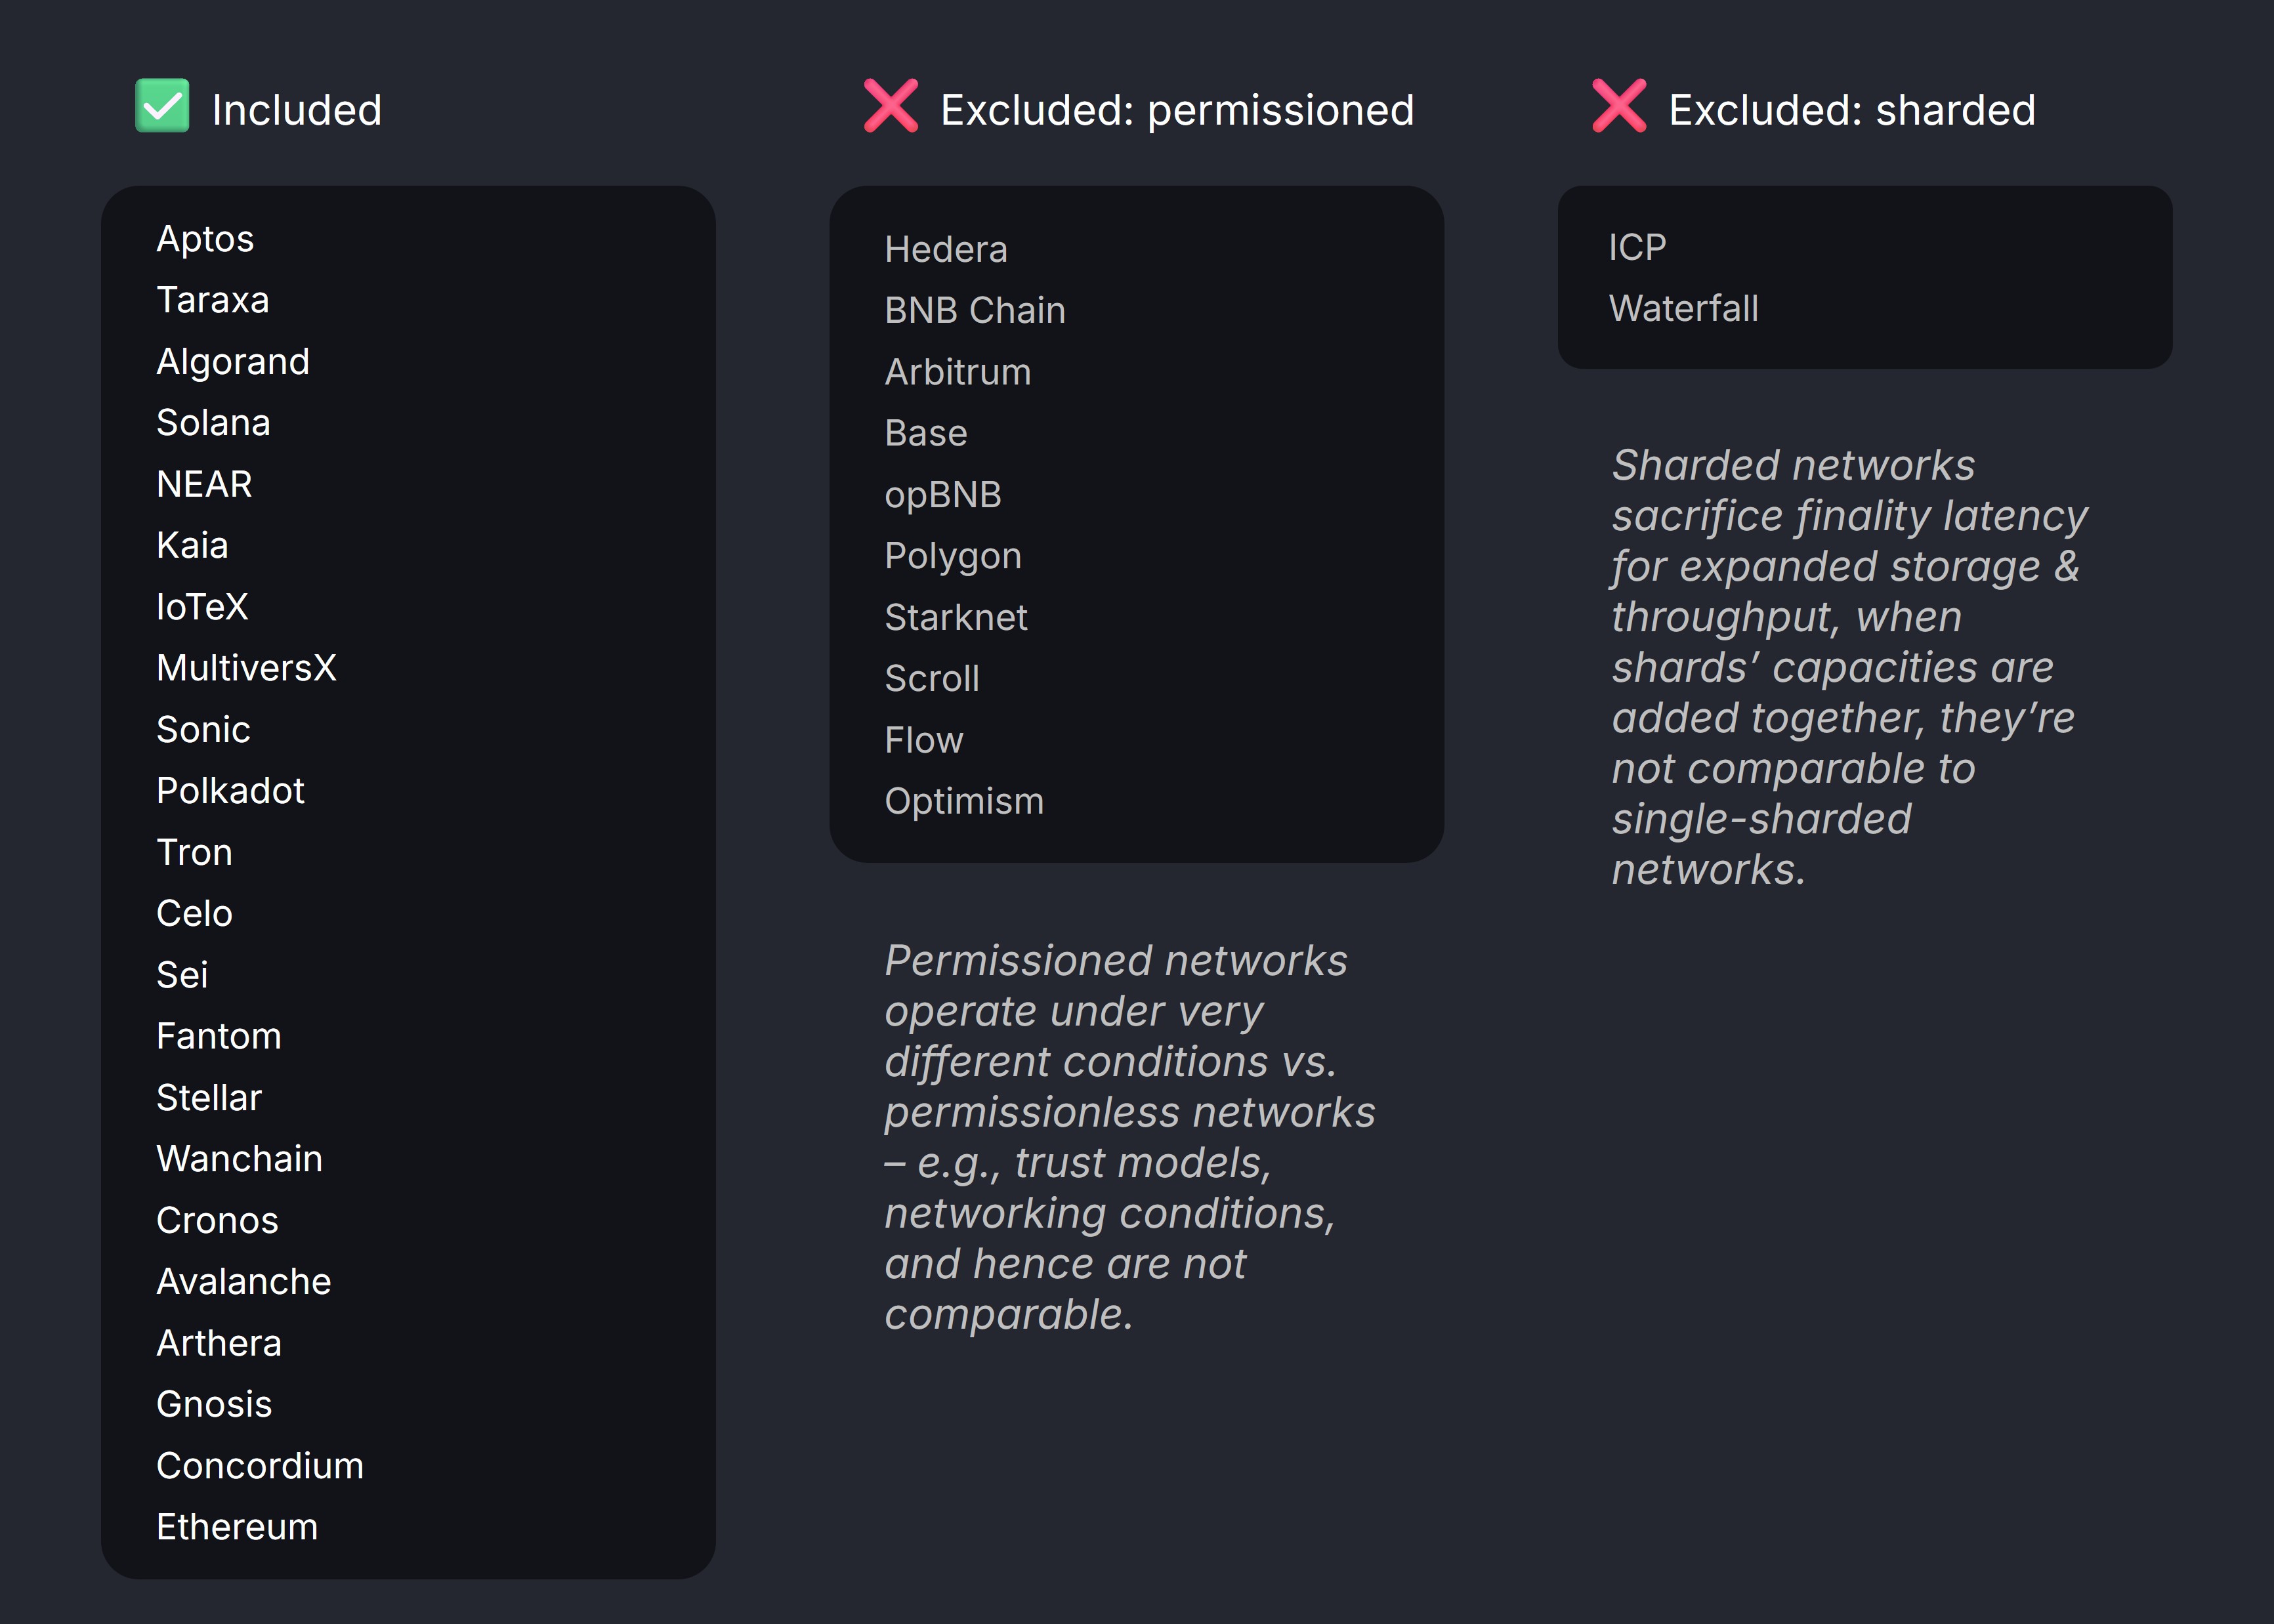
For this analysis, 22 networks are included,
- Permissioned networks (10) were excluded since they operate under very different conditions versus truly permissionless networks, with far more relaxed trust models, assumptions on hardware configurations and networking quality, and aren't comparable to permissionless networks. Incidentally, every Layer-2 network on the list are also permissioned.
- State-Sharded networks (2) were excluded as they trade off finality latency for expanded storage & throughput which isn't reflected in the pure throughput metric, and the shards do not share the same state, together making the sum of metrics across shards fundamentally incomparable to single-shard networks with single shared states.
We then take the maximum ever-achieved historical on-chain TPS across a 100-block range as measured by Chainspect .
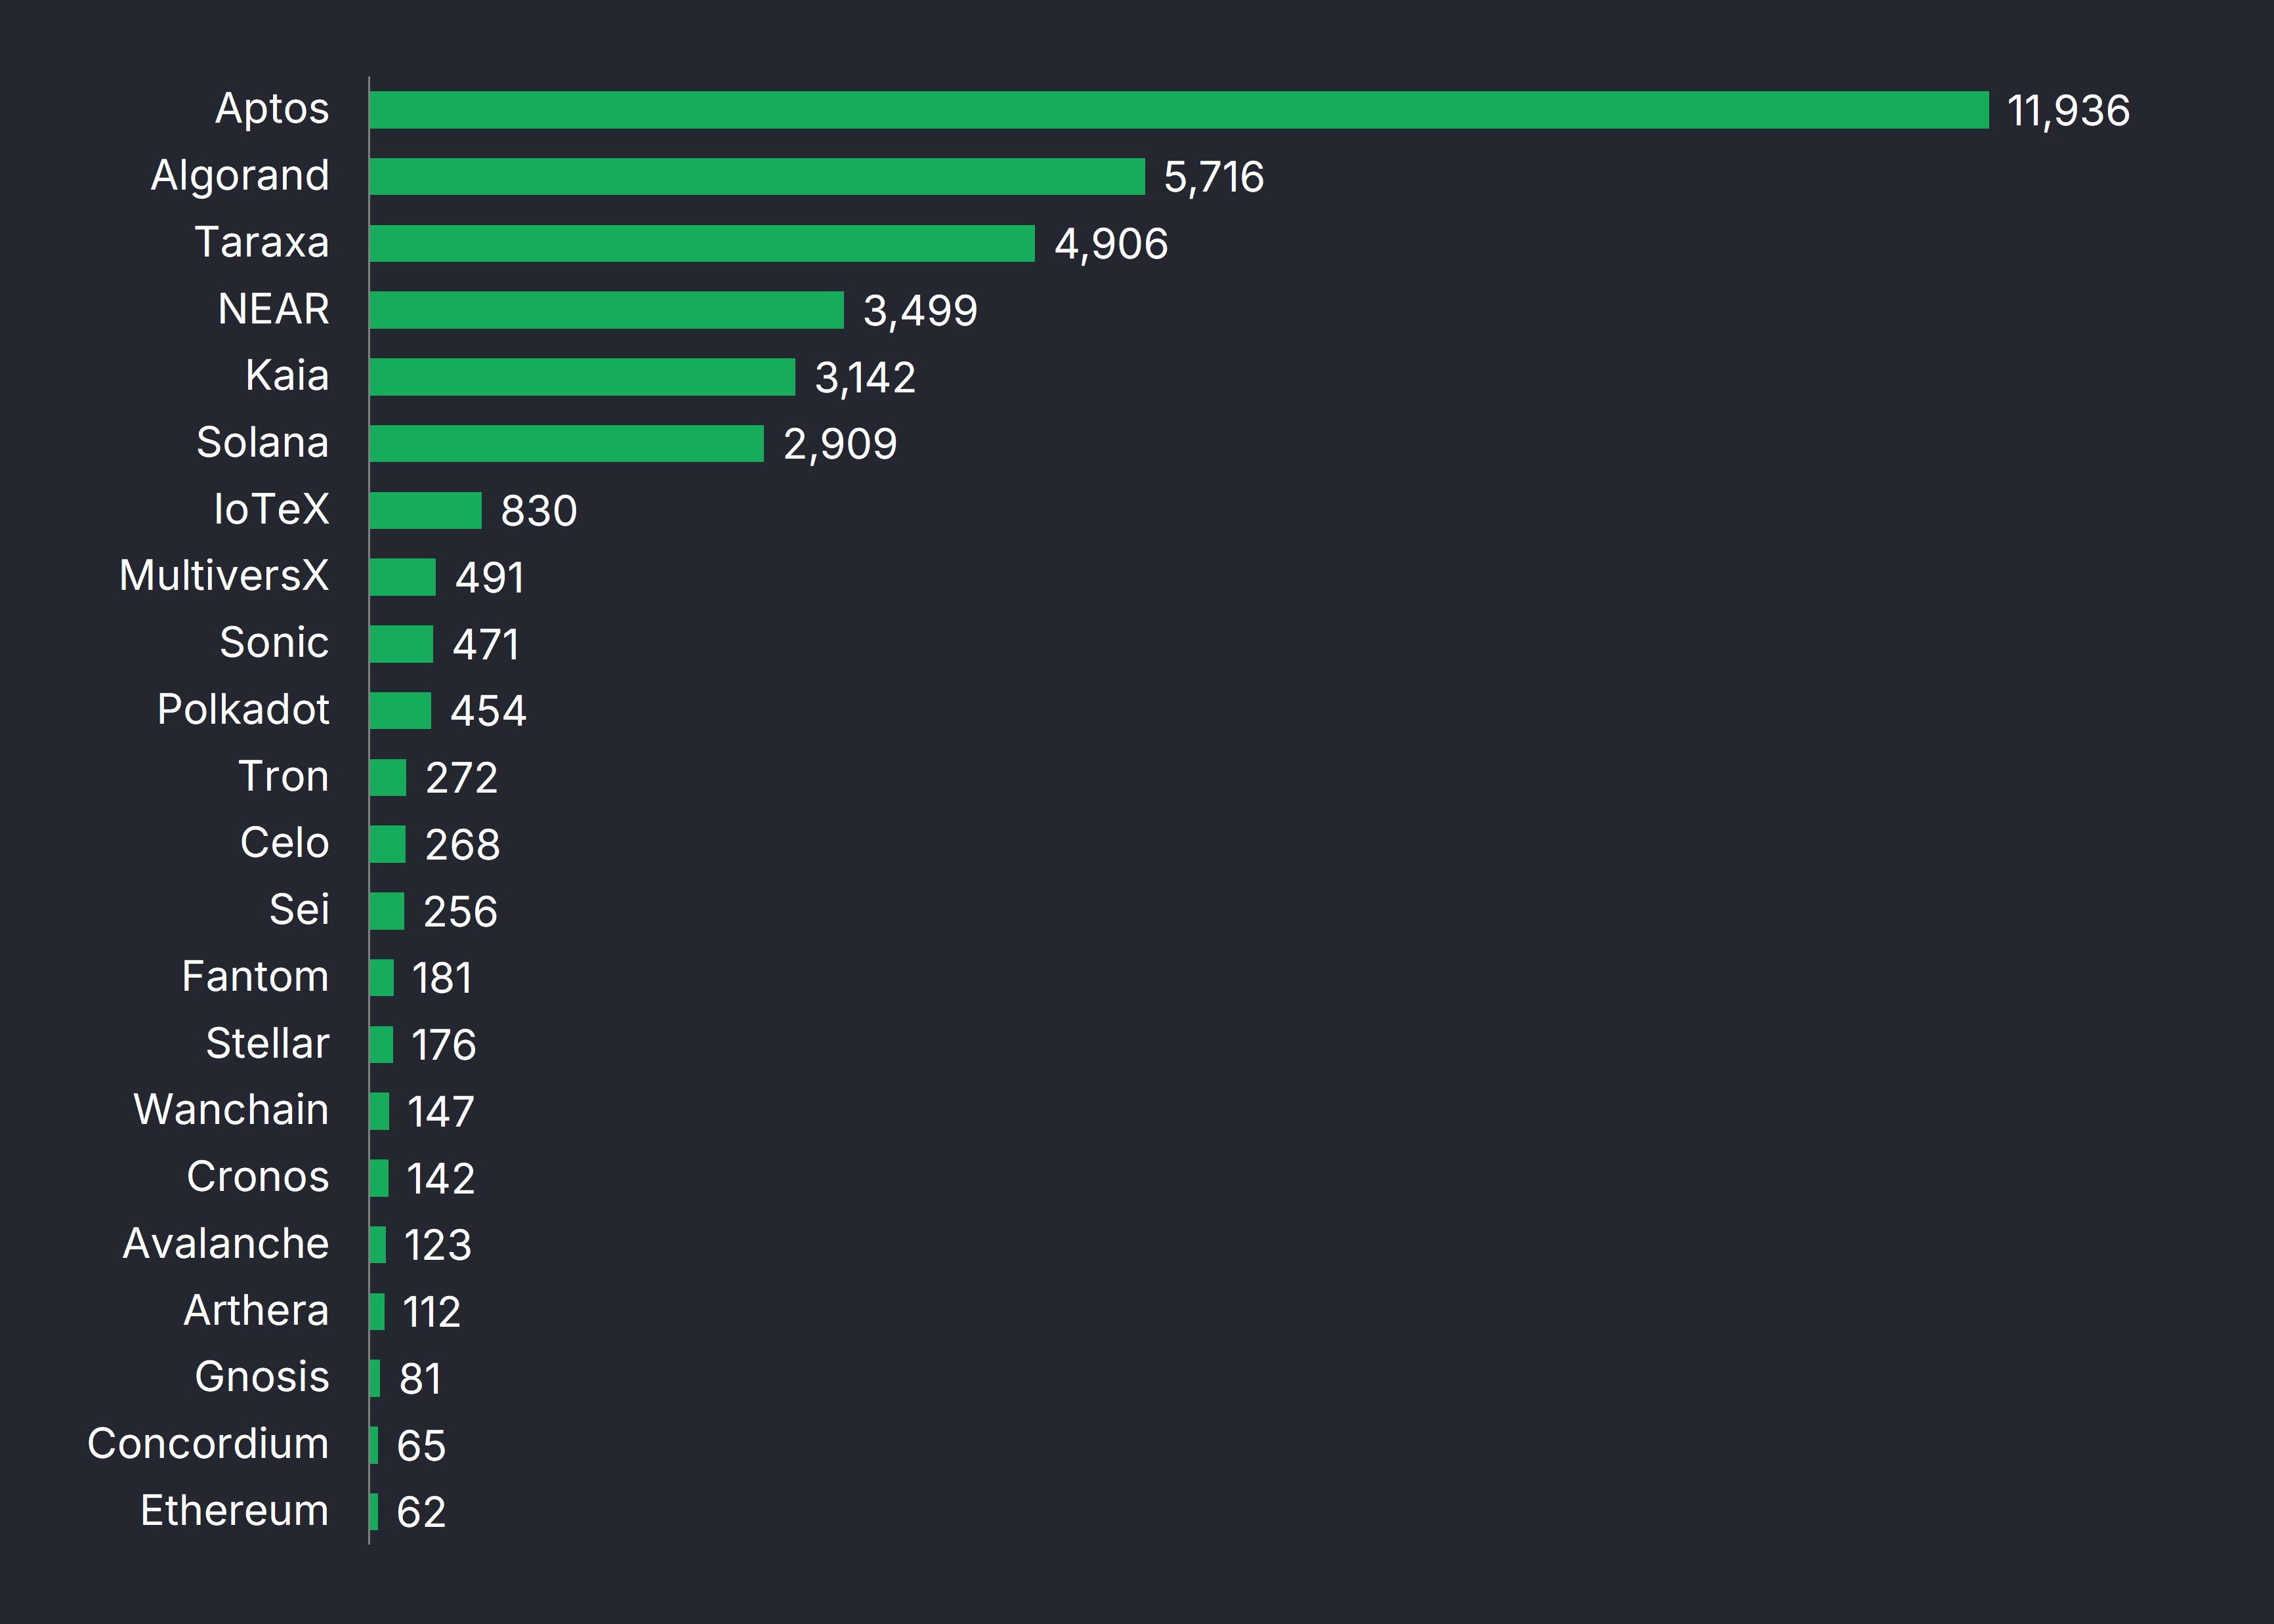
It's worth noting that Chainspect specifically excludes transactions that may unfairly inflate this Max TPS metric, such as voting transactions. Exclusions are highly specific to each network and are clearly labeled by hovering over the "?" icon for each entry in the Max TPS column.
As a side note, a poignant example of a marketable yet misleading performance metric is the maximum theoretical TPS, which is also collected by Chainspect. According to Chainspect, this number is sometimes extrapolated, but often simply provided by each network's developers themselves.
Unsurprisingly, the gap between theory and reality can be extreme: on average, there's a 20x difference between the Theoretical TPS vs. the Max Observed Mainnet TPS.
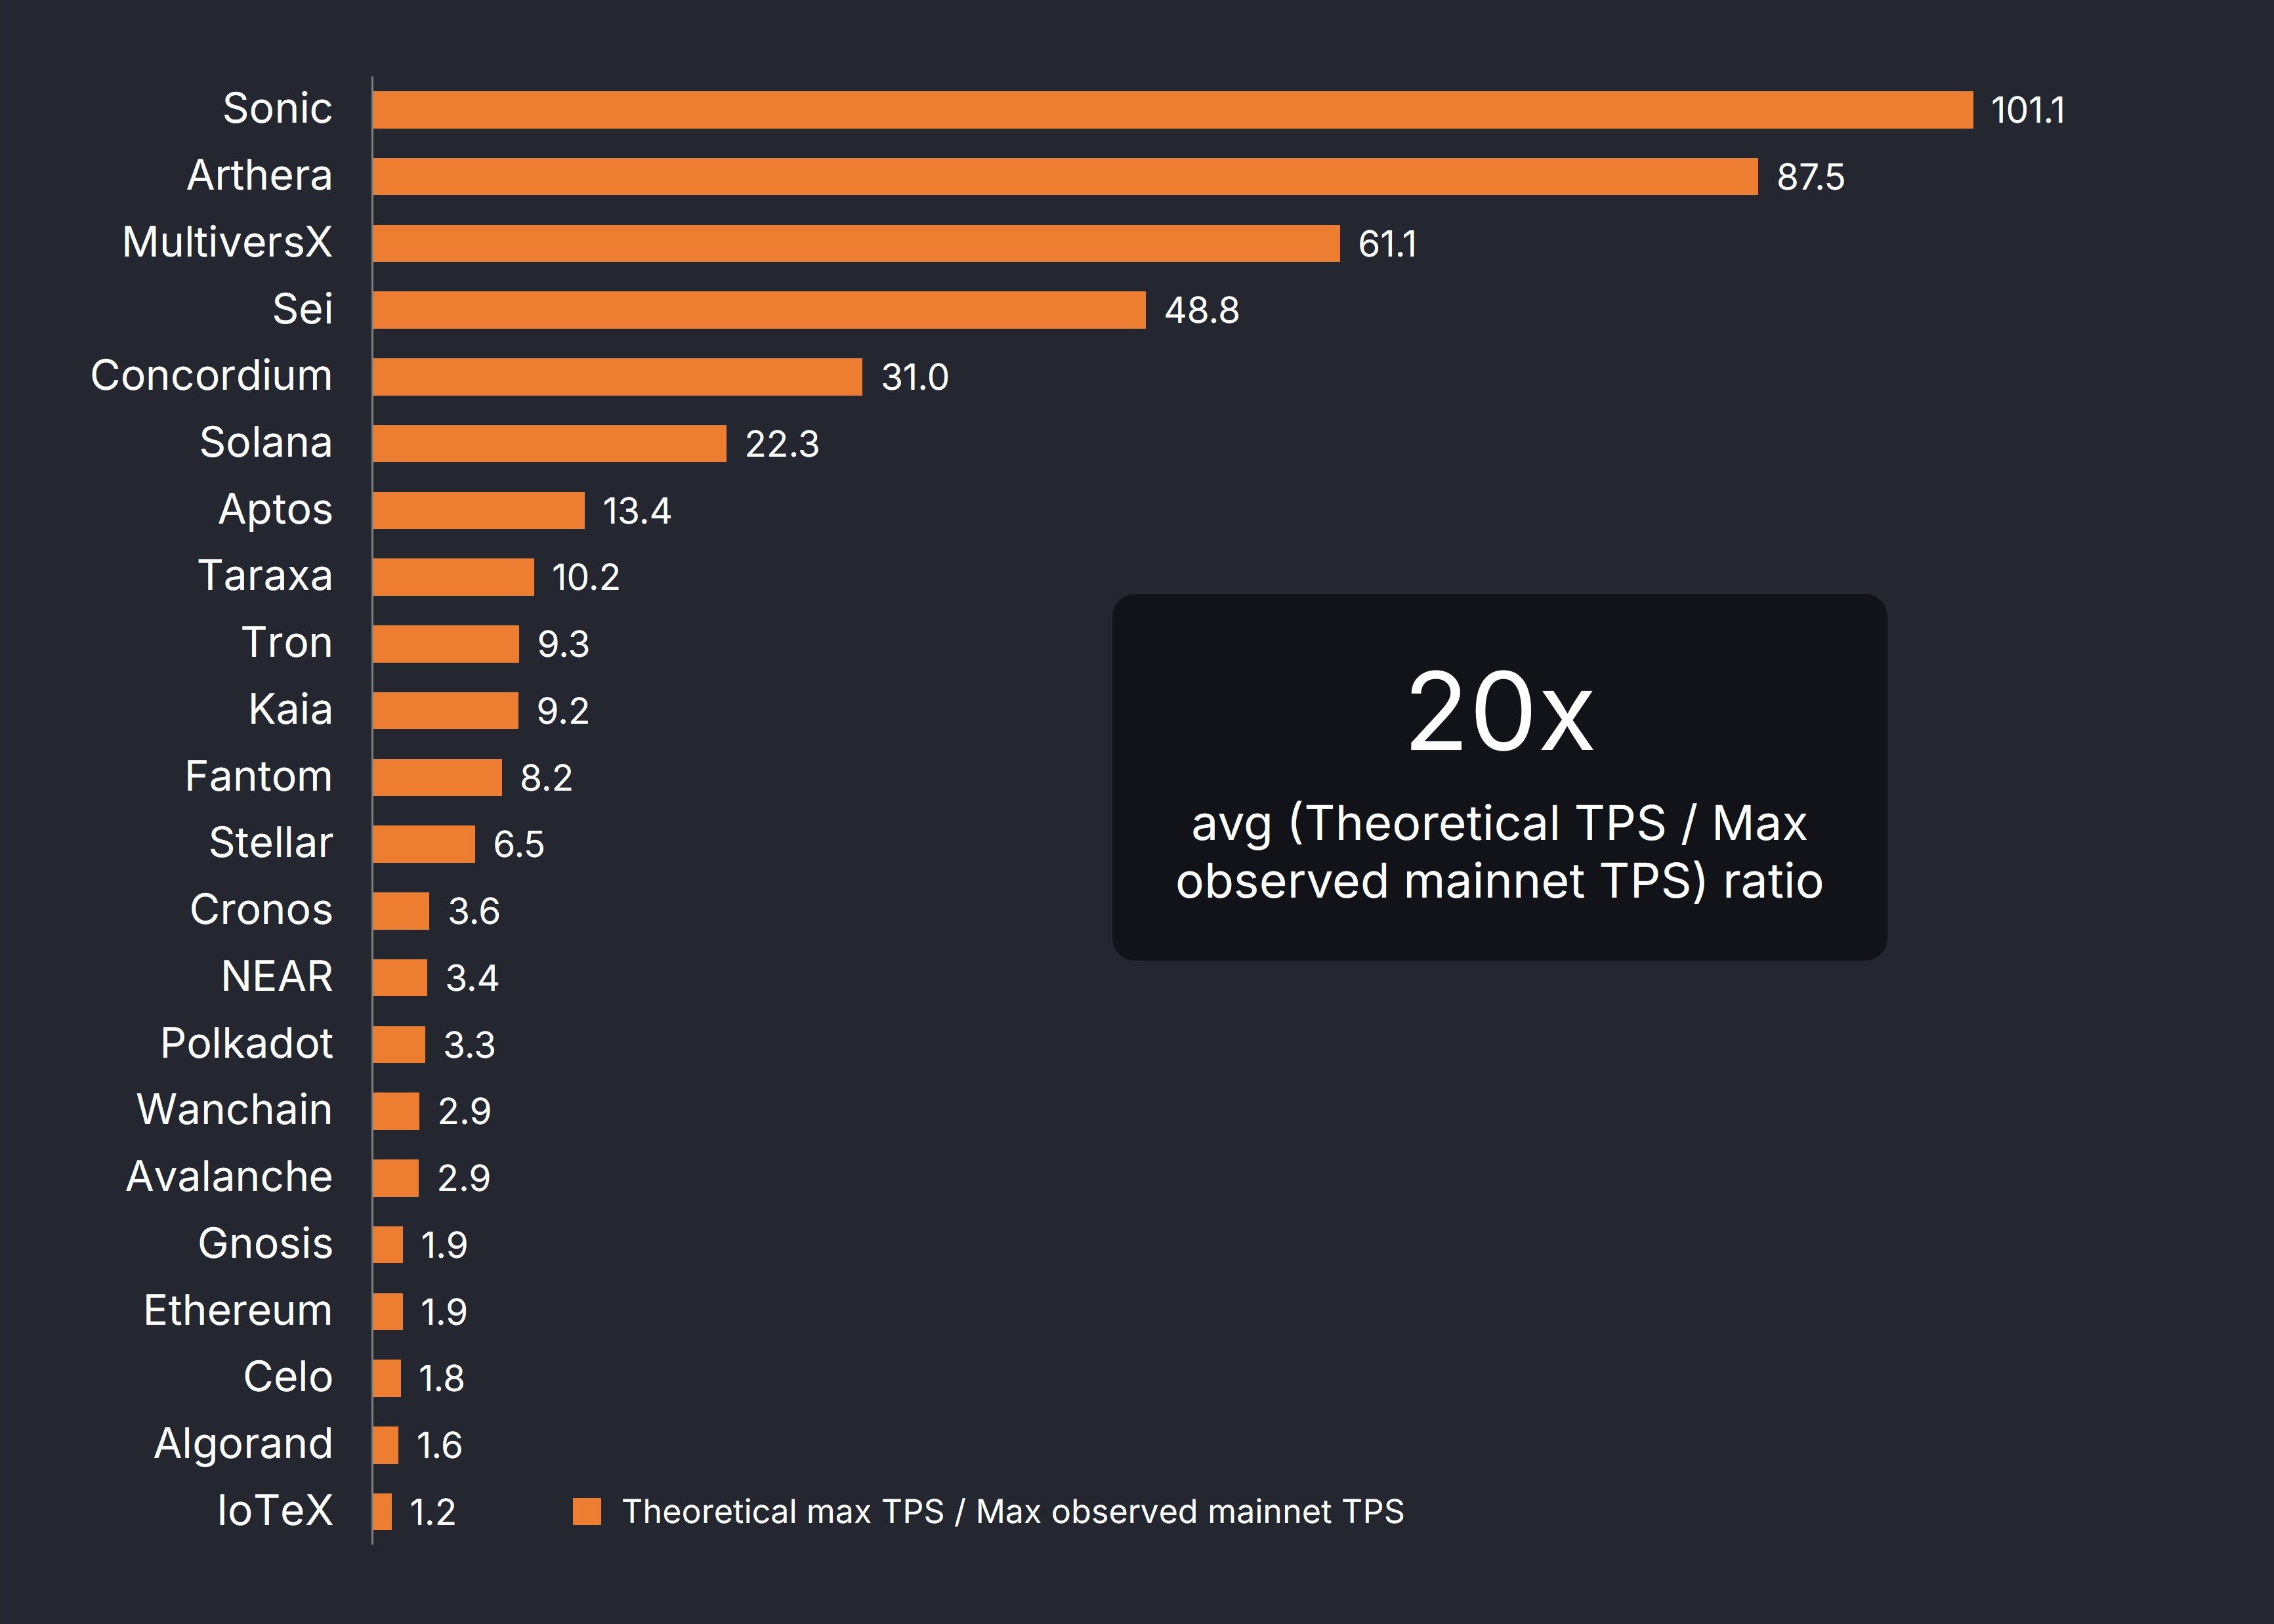
We should all stick with transparent, verifiable, on-chain performance metrics.
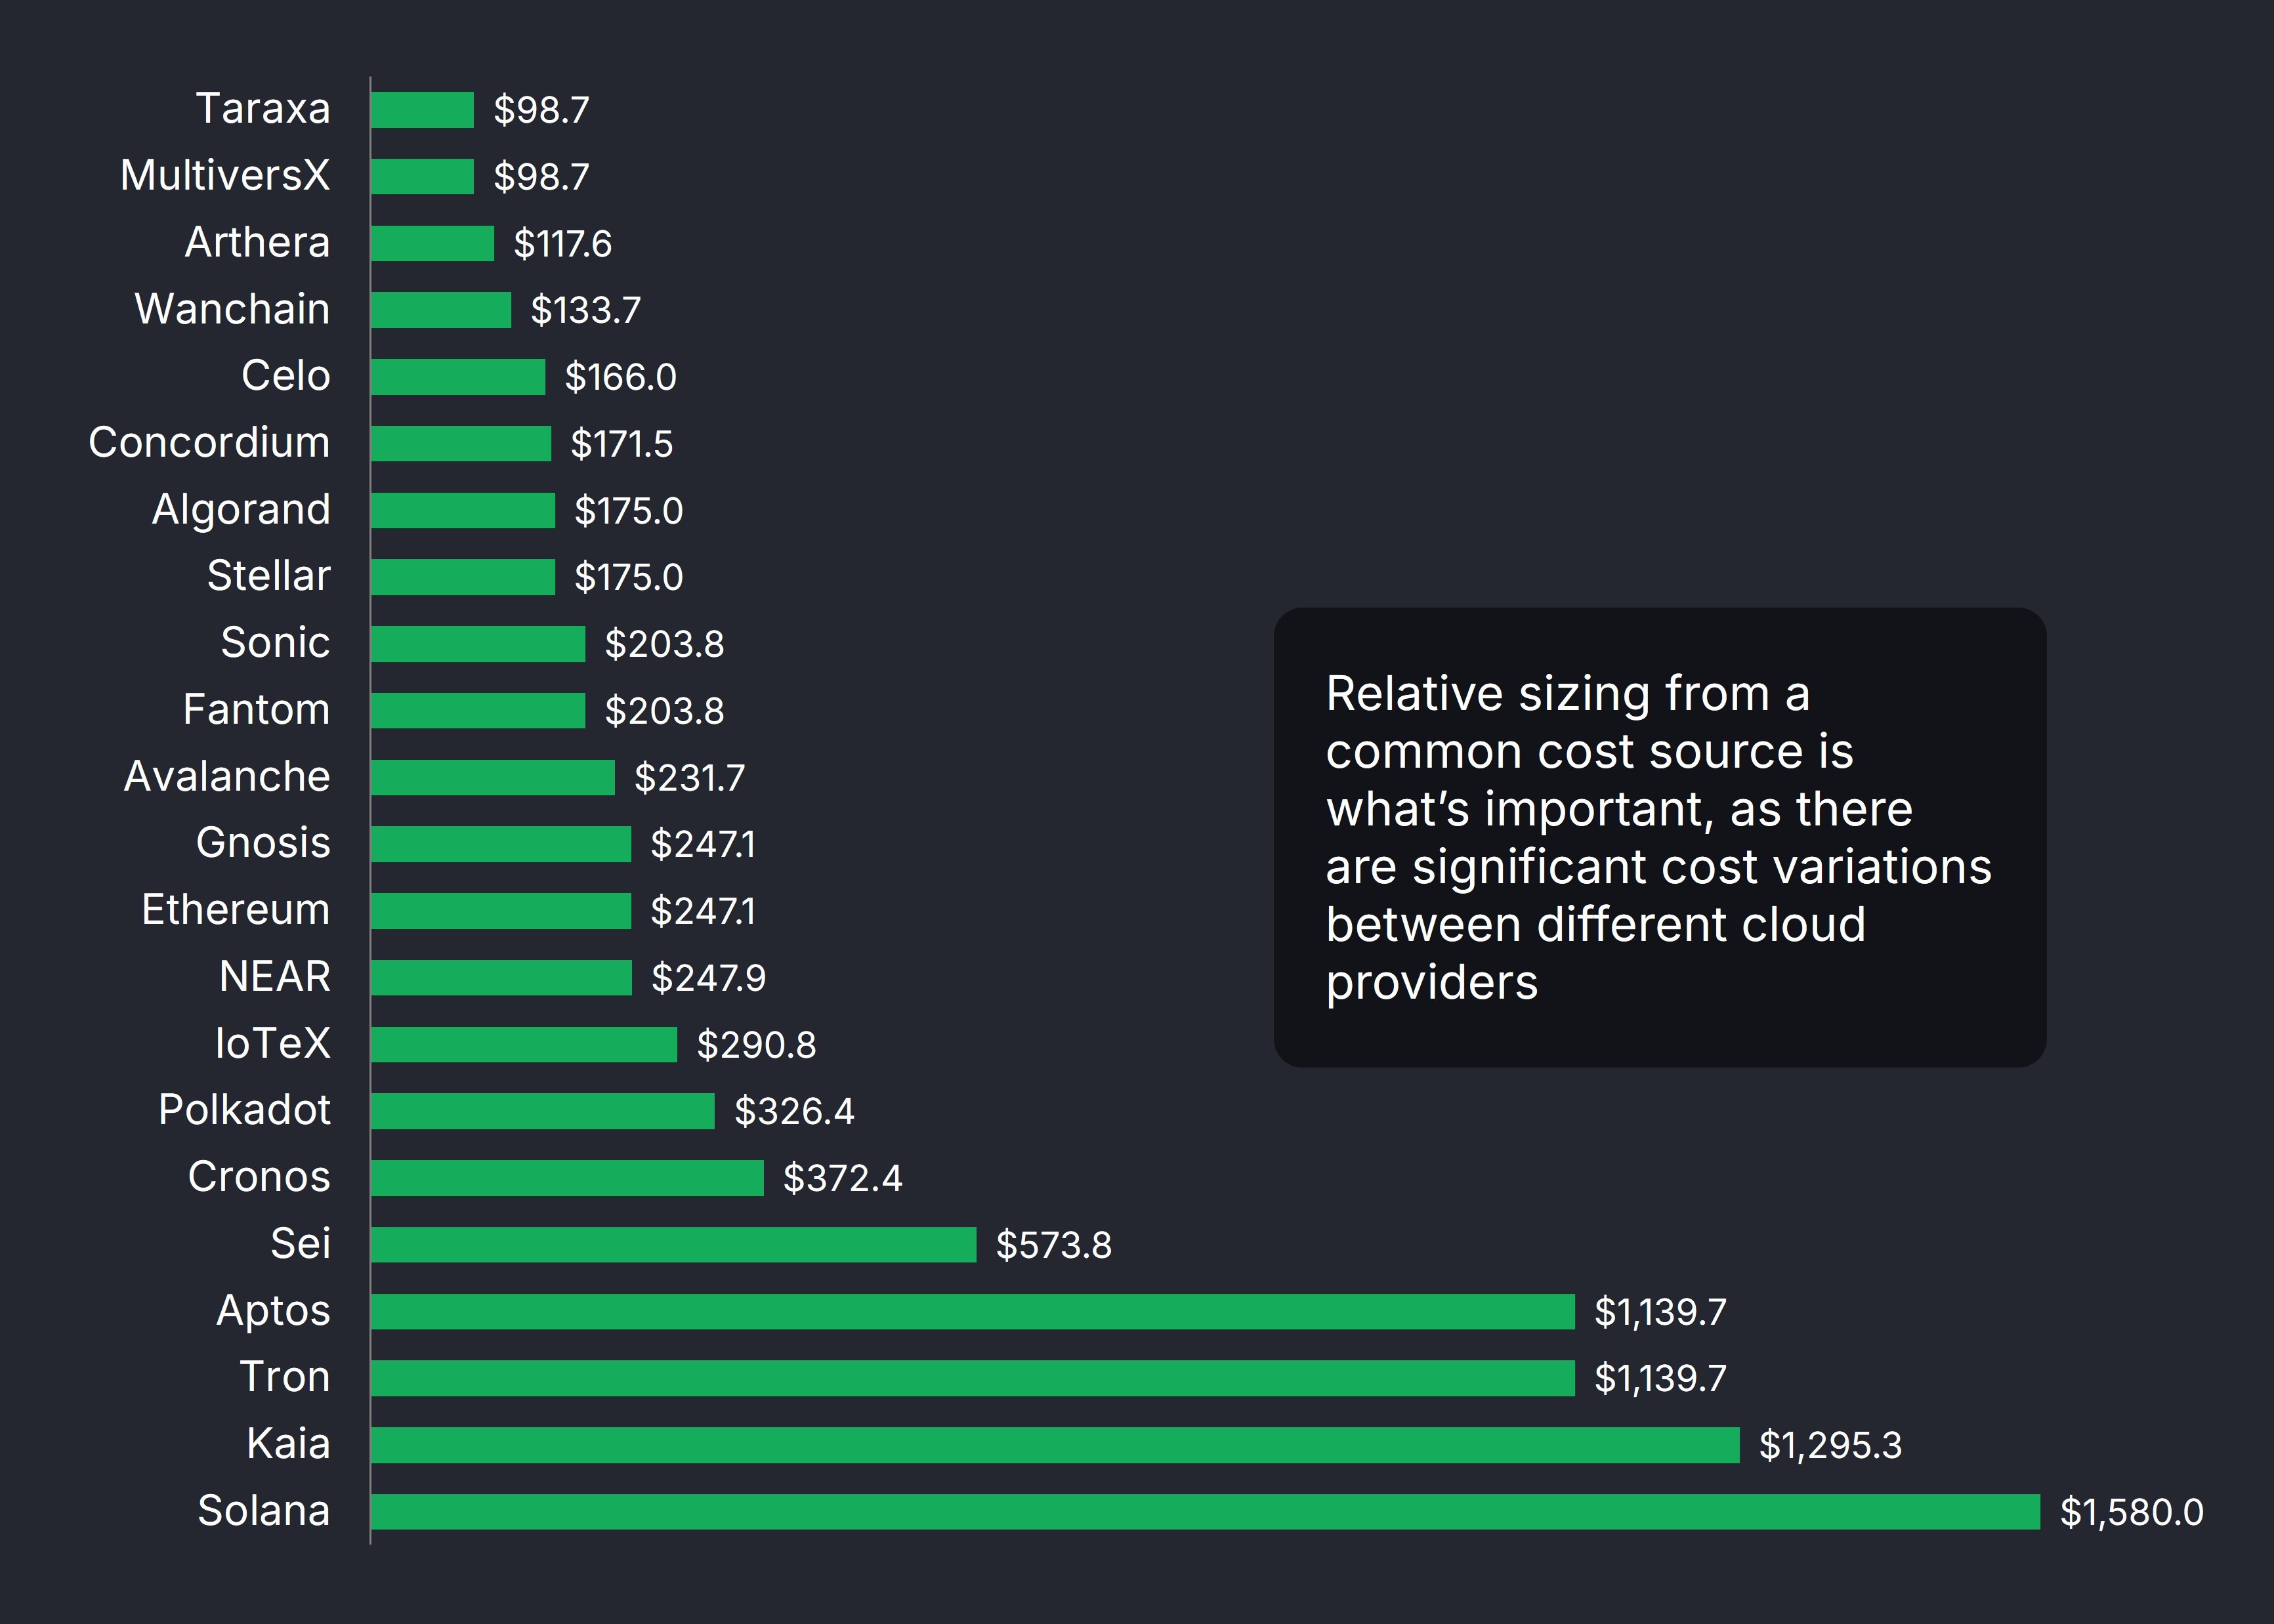
Cost per Validator Node
To determine the hardware cost of a validator node for each network, we first find the minimum validator hardware requirements for each network from their respective official documentation. You can find all the documentation web pages that were used to source the minimum hardware requirement in the links in the "Project Name" column: https://taraxa.io/fast/data .
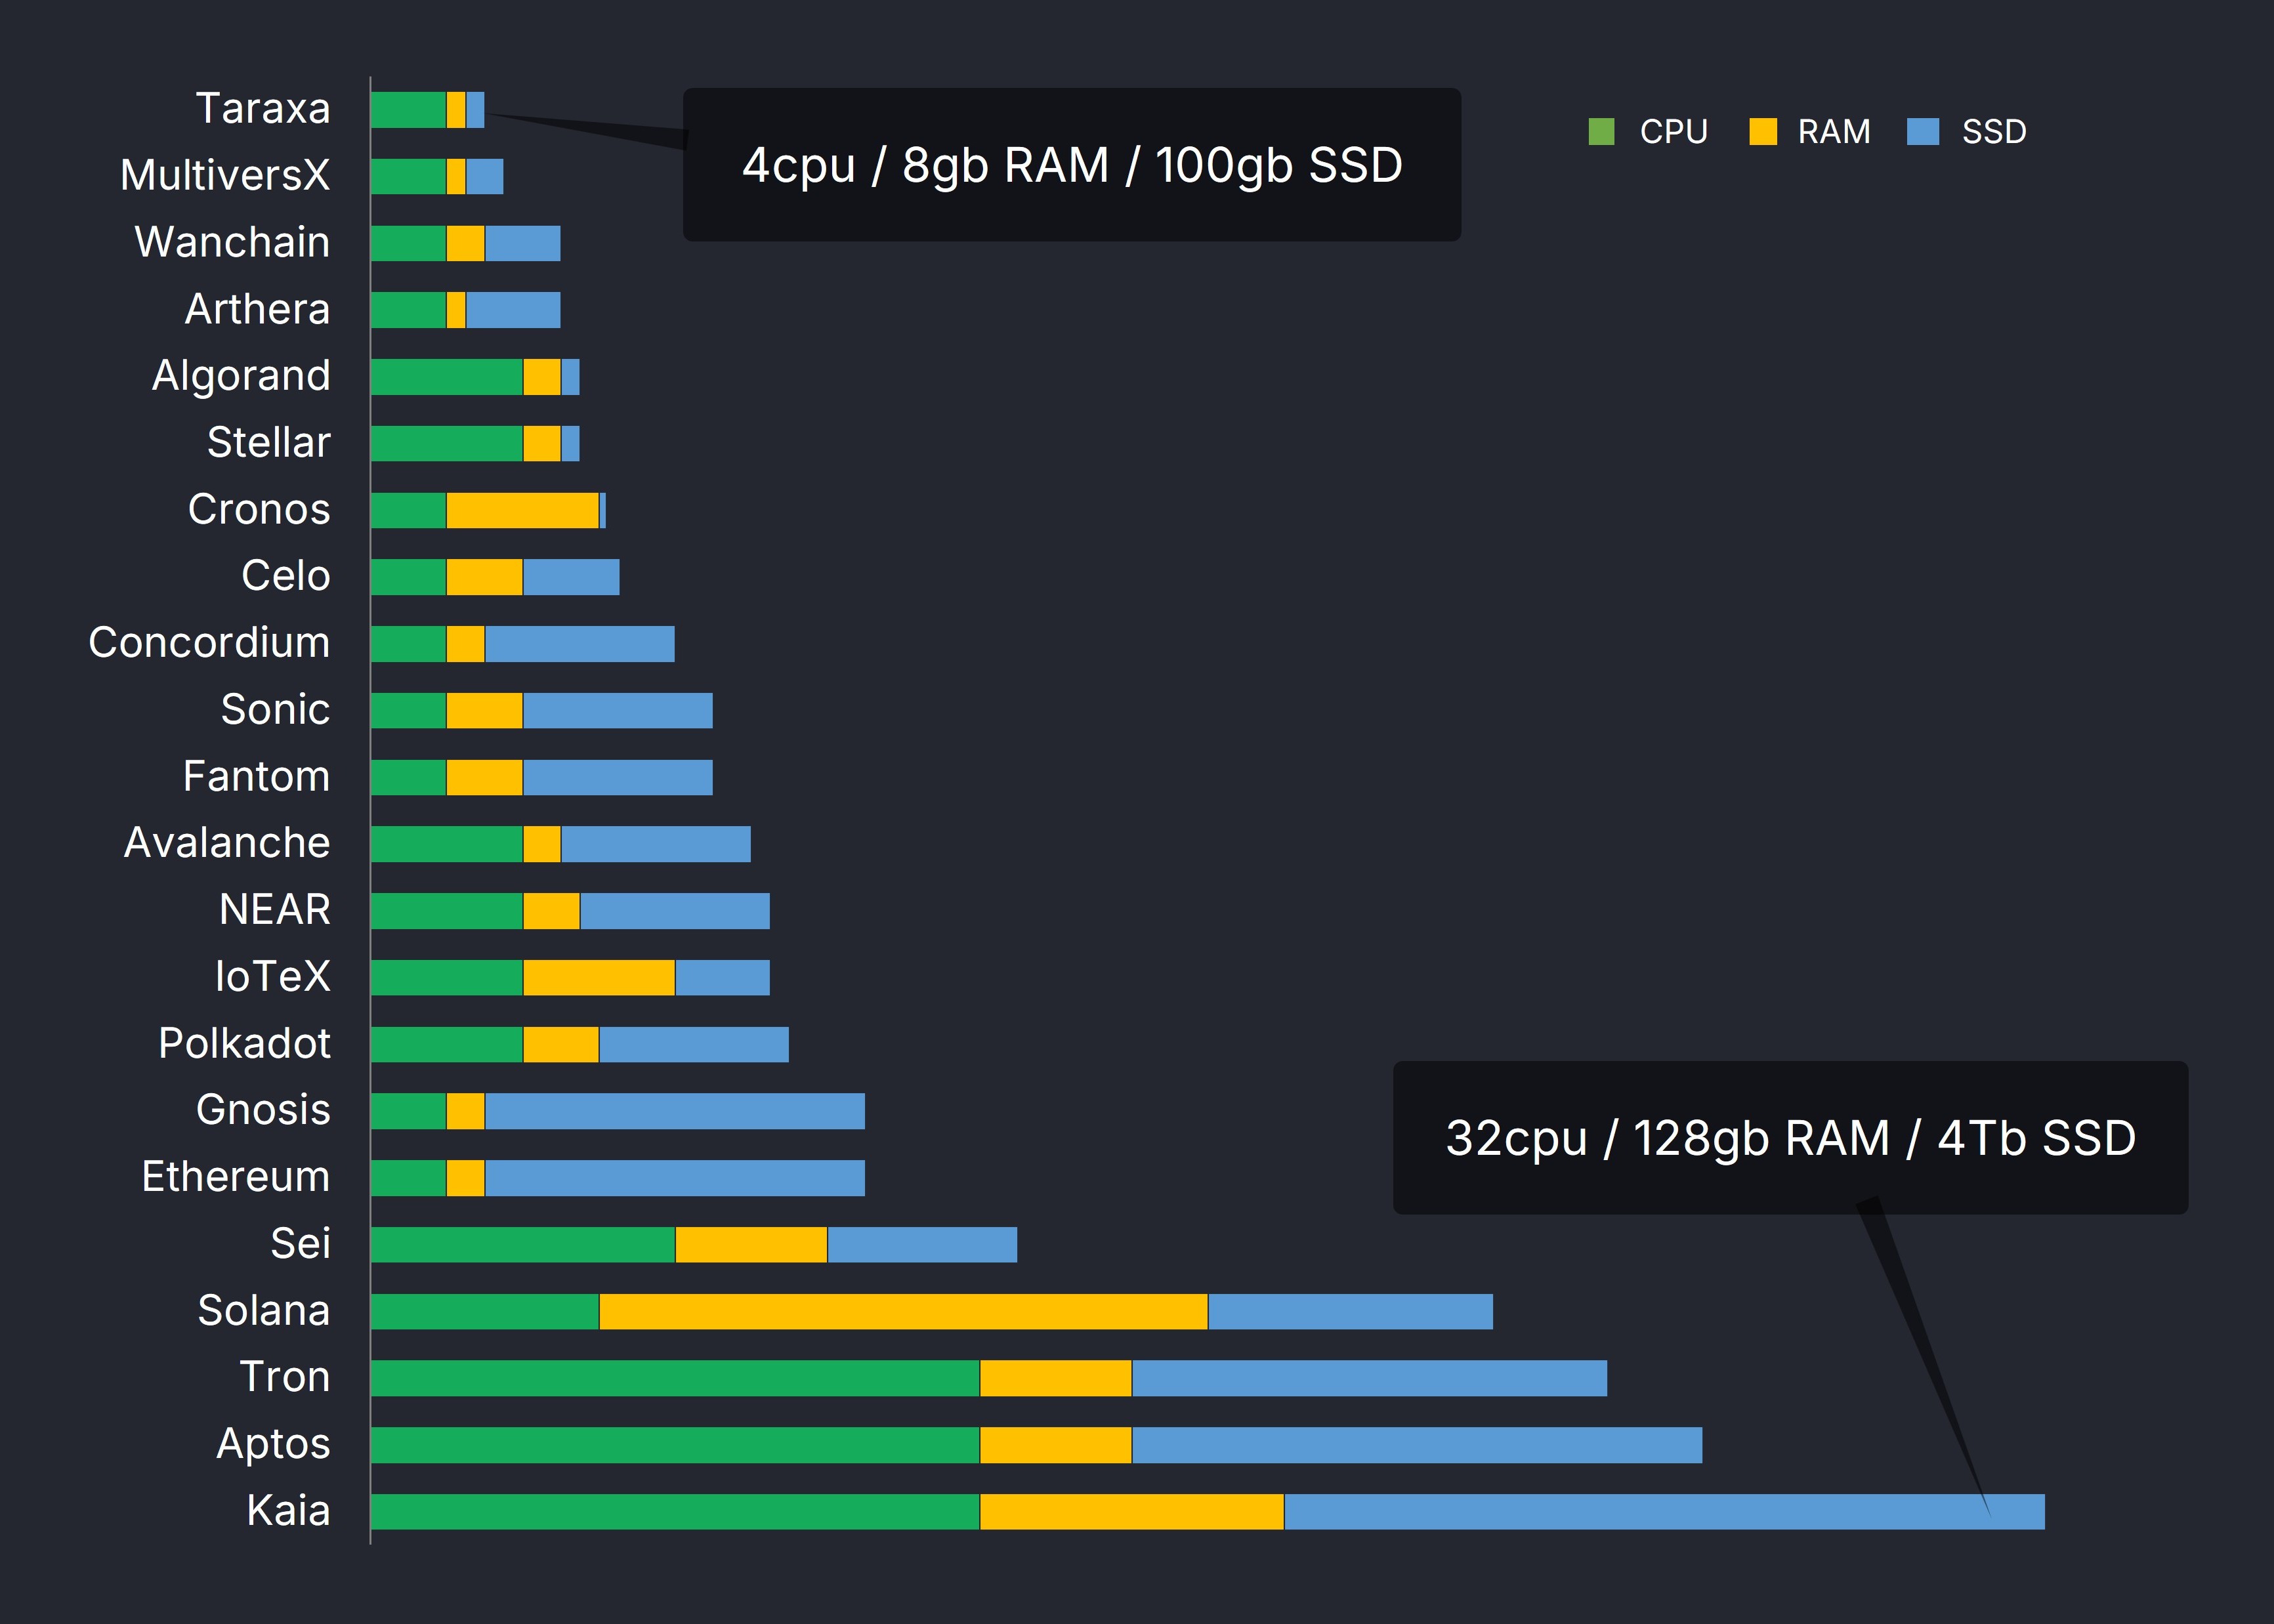
Based on these official validator hardware requirements, we estimate their monthly cost using the Google Cloud Calculator. The absolute dollar amounts obtained from the GCP calculator are not important, what is important is the relative sizing when used to compute the TPS per dollar ratios. It's also important that they all come from a single consistent source.
You can find every single configuration linked in the data sheet: https://taraxa.io/fast/data under the "GCP Config" column.
Here are some default settings for the GCP calculator,
- Machine family: General purpose
- Series: N2
- Machine type: Custom machine type
- Boot disk type: SSD persistent disk
- Boot disk size: 20GB
- Committed use discount options: 1 year
Here are some quirks of the GCP calculator if you wish to reproduce the results yourself,
- The Local SSD is quantized to multiples (1, 2, 4, 8, 16, 24) of 375gb, but impact to cost is not too significant since this is a pretty inexpensive resource compared to CPU and memory
- If you want memory to go above 32gb, you have to toggle "Extended Memory"
- The GCP calculator auto-switches machine type to pre-configurations for Machine Type when you select certain CPU and memory setups, to keep the cost estimates consistent, adjust the Machine Type back to "Custom machine type"
Here are all the monthly cost estimates for the networks in the analysis.
Result: Taraxa has the highest realized mainnet TPS per dollar spent on validator nodes
To calculate our proposed "realized mainnet TPS per dollar spent on validator nodes", we simply take the realized mainnet TPS (tx/s), and divide it by the GCP-estimated validator hardware cost per month ($/month).
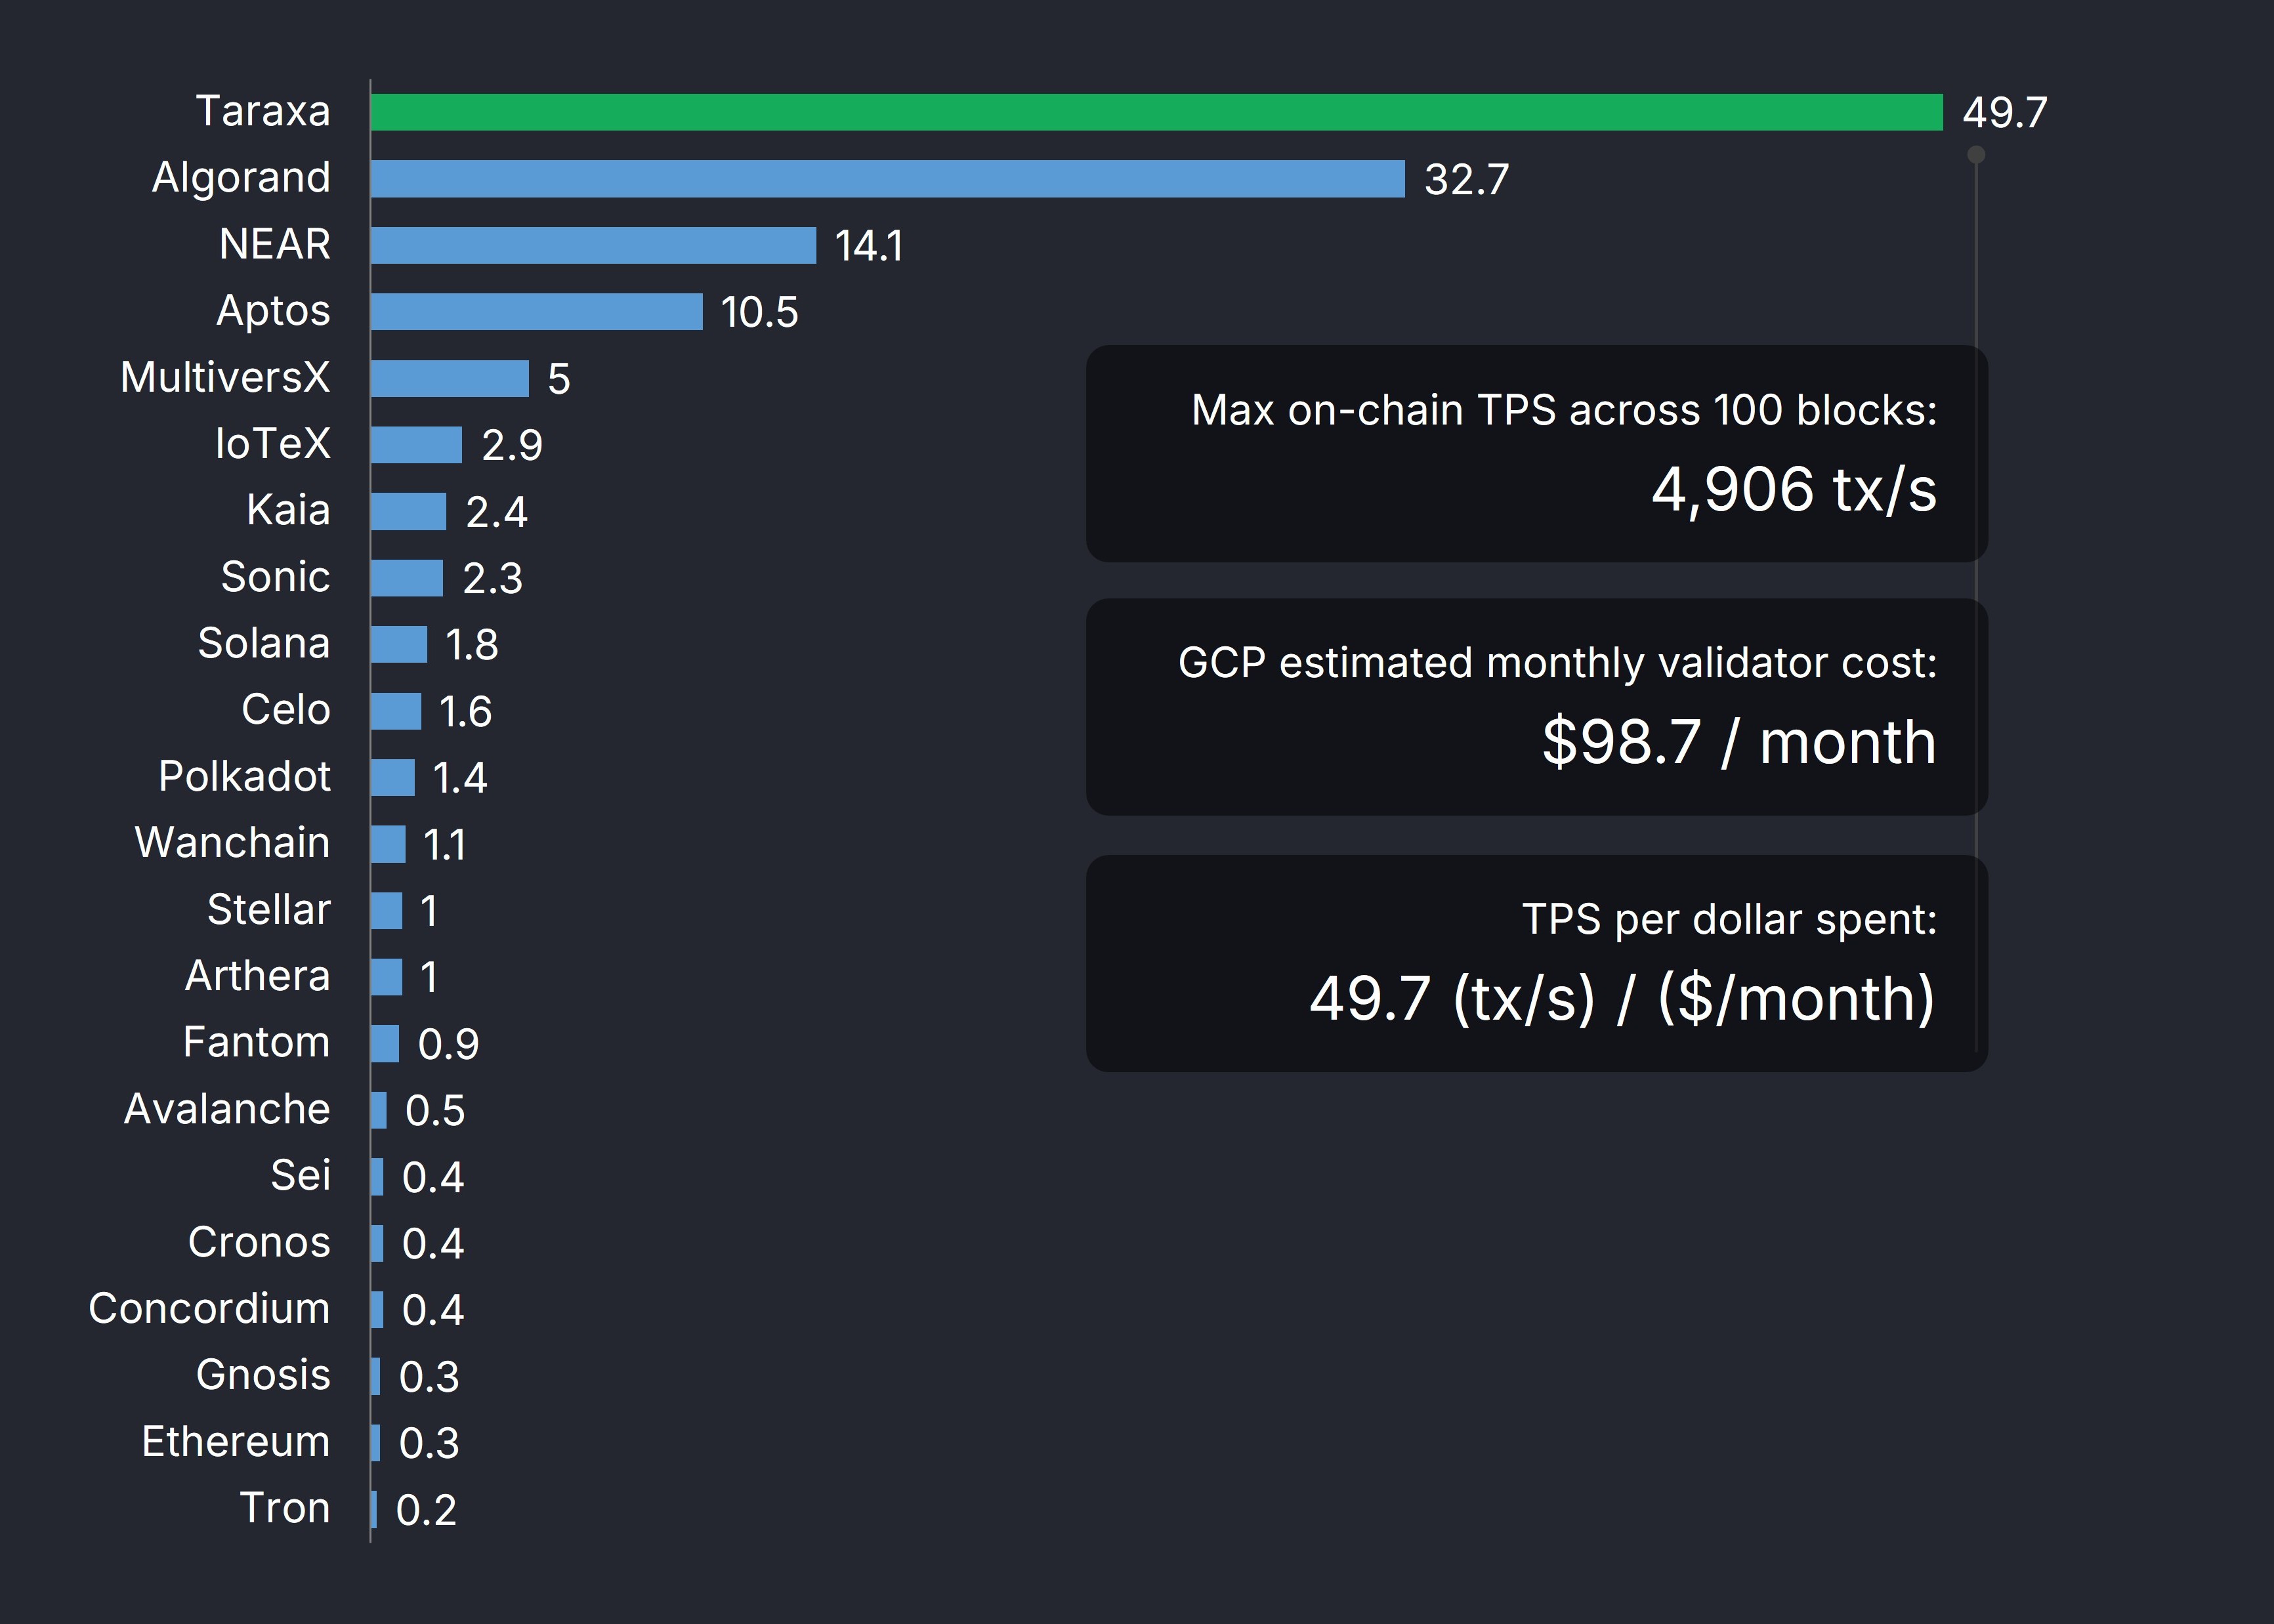
In this current study, Taraxa achieved the best TPS per dollar spent,
- 4,906 tx/s on mainnet (averaged across 100 PBFT blocks)
- 98.7 $/month estimated monthly validator cost from GCP calculator
- 49.7 (tx/s) / ($/month) TPS per dollar spent on a validator per month
This makes Taraxa the world's highest realized mainnet TPS per dollar spent on a validator node, or simply, TPS per dollar spent for short.
All data in this study are found here: https://taraxa.io/fast/data
While no performance metric is perfect when comparing across such a wide variety of Layer-1 networks, we do believe that the best performance metrics need to be transparently verifiable (on mainnet), and balanced by efficiency (resource consumption).
We hope to keep working to update and refine these performance metrics to help introduce a bit more sanity back into the crypto landscape.
Stay tuned! 🪁